An opinion piece: bioST@TS is a most important learning tool in analytical population ecology
 Mads Forchhammer, Department of Arctic Biology, UNIS
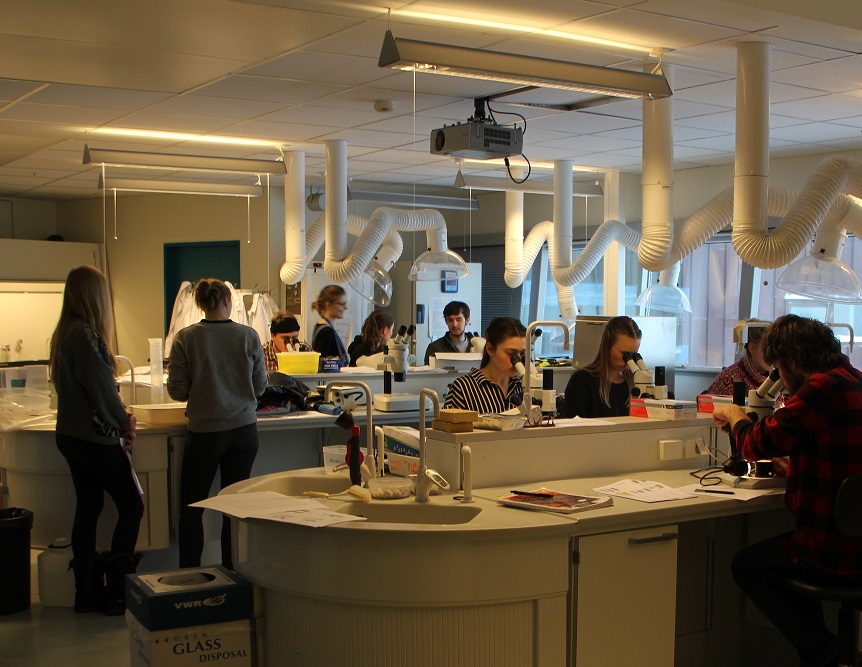
“Population ecology is about interactions …” was probably the first I said to my bachelor students in the UNIS course AB204 Arctic Population Ecology. Embracing enthusiastically the attention the students gave me this first morning, I continued “… and we will learn to not only understand biological interactions within the population of a single species, but also how this species interact with other species of its community as well as how the interactions within the species and in its community are affected by environmental conditions, such as climate change …”.
Standing in the middle of the classroom, I realised that I lost about 80% of the students with that sentence. What to do? Well, I went for what taught me ecology back in time … drawings! A visual display of complicated thoughts and ideas! The blackboard became my learning instrument, as I with a professional stroke, I thought, drew a reindeer on the blackboard. The laughter was instantaneous and despite my immediate disappointment of the lack of approval of my creative range, I knew I had the students back with me!
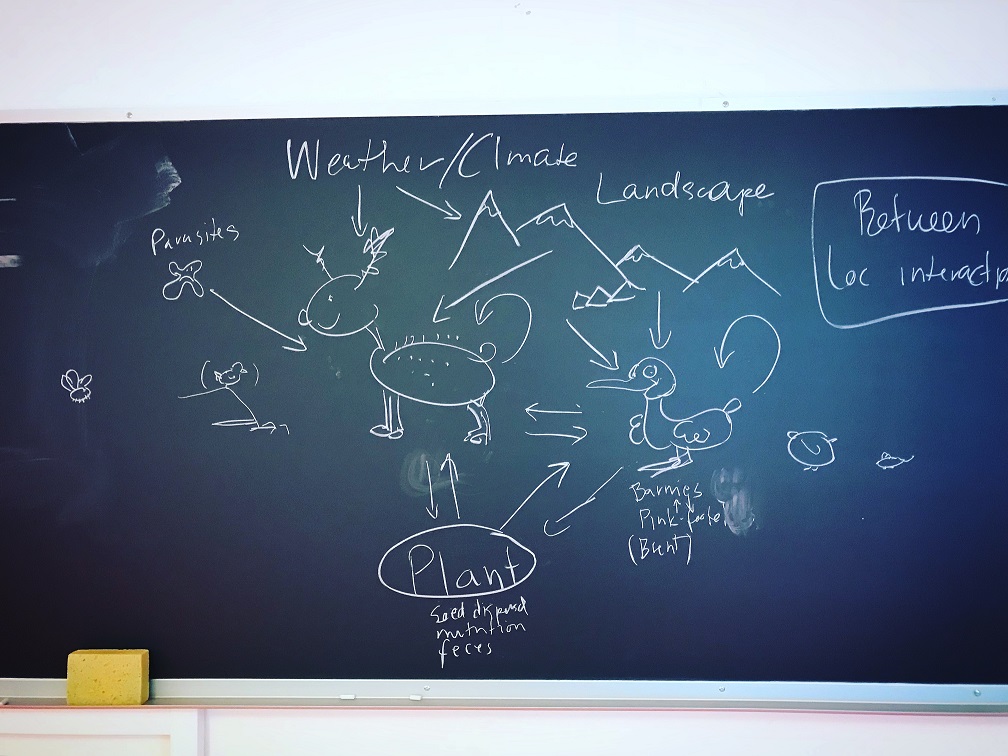 Together we went on portraying reindeer, geese, vegetation, landscape and climate and all with arrows between them. And it became immediately clear that the arrows were what Arctic Population Ecology was about. Never underestimate the power of the classic use of blackboard.
Having said that, I knew that my students would be confronted by the analytical component, which is so important to population ecology. It was not just the ability to see the arrows on the blackboard but, indeed, also being capable of estimating them quantitatively as well as their relative importance for the function of the ecosystem. And for that, it was important to introduce ecological theory with statistics.
I have worked with statistical software R for years and have through painstaking effort learned its range and opportunities and obvious benefits. However, as a learning tool, I have struggled because, even with the GUI called “RStudio”, it is not the most accessible analytical toolbox for students.
However, I was made aware of bioST@TS by my colleagues at Arctic Biology, UNIS. And it changed my appreciation of R as learning tool. bioST@TS was developed with the aim of making the teaching of statistics accessible for biology students without “strangling” them in technical details. And in my opinion bioST@TS succeeded. It is a very pedagogical introduction to statistics using R and it introduces basic descriptive statistics as well as analytical statistics.
Being a population ecologist, I find that students must not only learn descriptive statistics, but also, and perhaps more important, to analyse biology in a context. That is, including descriptive statistics with cause-and-effect analyses. And in bioST@TS, I found a basic setting I could apply to the different components of my course. Using the basics statistical exercises provided by bioST@T in my population ecology gave me an analytical basis. Now, almost 2 months into the course, I have a clear understanding of how important the initial bioST@TS exercises were for the students. I meet a range of students, from novices to initial users of R that all benefited from this integration of bioST@TS into my course of Arctic population ecology.
So bioST@TS works! I am convinced that bioST@TS will provide an important basis for learning in statistics in biology. Having said that, I would recommend that future development of bioST@TS focused more on the complexity of biology rather than the complexity of statistics. There is a link on bioST@TS to Advanced statistics in R, which is under construction. I think this is fine, from a statistical point of view. However, I suggest, why not make advanced features of R available in biological context? I do agree that basics of statistics need to be in place and understood. However, I would argue that the way we biologists use R is from our biological point of view, not any statistically settings (to some extent). This is how I (and most of my colleagues) use R. I have biological hypotheses and questions. My students are confronted with biological questions too. Why not make this obvious in the use of bioST@TS?
An example. Time is an important factor in biology. Time changes. We have seasons. Seasons are important in the Arctic. But looking beyond the arctic seasons and expanding the concept of time, climate changes and some of the most potent questions in biology these years are addressed in a temporal (and spatial) context. This makes the capacity of analysing biological data in time of a paramount importance for biologists. Why not introduce the statistical settings of auto-regression as a way to understand the biological changes in time? Time series analyses in biology was adopted from economics in the 1990ies by foreseen biologist like Royama and have since then developed statistically in a biological setting. We should use that knowledge.
We must continue the learning of statistics from a biologists perspective.