Teach to Learn is at 78° North!
Under the Teach to Learn project, a new series of video tutorials were realized by the BSc students of the Arctic Ecology and Population Biology course (AB204) at the University Center in Svalbard UNIS (78°N latitude) to help their peers with ecological understanding of Arctic shorebirds, their feeding habitat, statistical analyses, and importantly, the use of the statistical software R.

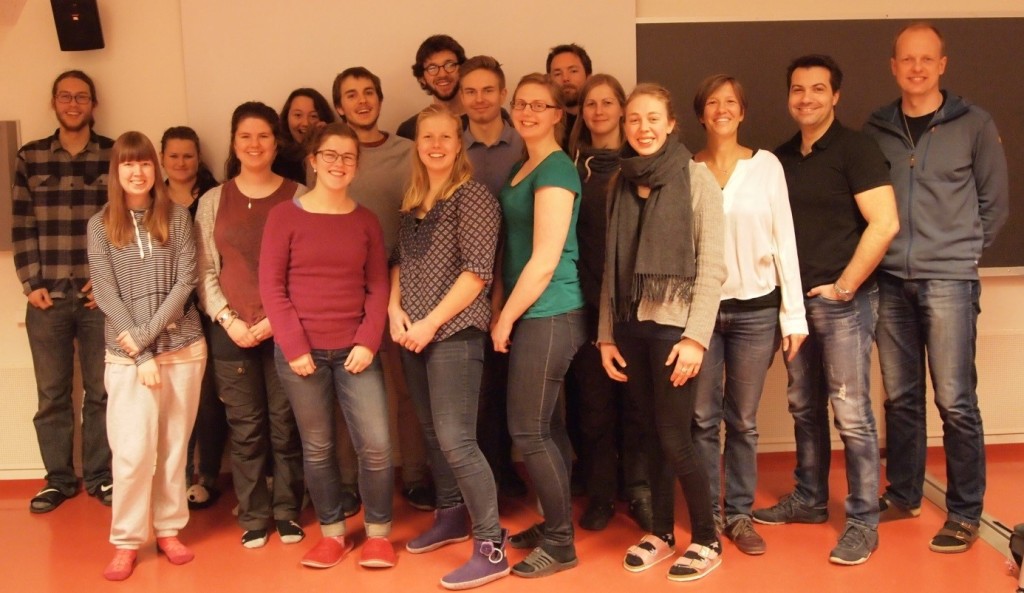
Students from the Arctic Ecology and Population Biology course (AB204) participating to the Teach to Learn (TE2LE) project and from the right, Associate professor Øystein Varpe (Leader of the AB204 course), Jonathan Soulé and Anne-Laure Simonelli (TE2LE team). Photo: Paolo Simonelli.
Under the guidance of the TE2LE team (Anne-Laure Simonelli and Jonathan Soulé), four groups of students elaborated video tutorials applying knowledge acquired during the course. These videos answer the following questions using the statistical software R:
- Tutorial 1 How to find population peaks in R – a visual representation?
- Tutorial 2 How to use the which.max function in R to find the peak abundance?
- Tutorial 3 Is a sample representative of a total count?
- Tutorial 4 Plotting time series of temperature fluctuations through the year in Arctic using R.

TE2LE team guiding students through the creation of their video tutorial. Photo: Paolo Simonelli.

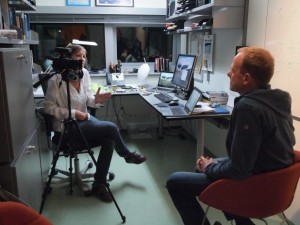
Associate Prof. Øystein Varpe interviewed by Anne-Laure Simonelli to evaluate the TE2LE activities. Photo: Paolo Simonelli.

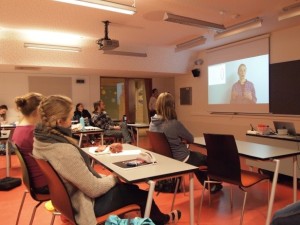
Students watching the video tutorials they created with TE2LE. Photo: Paolo Simonelli.

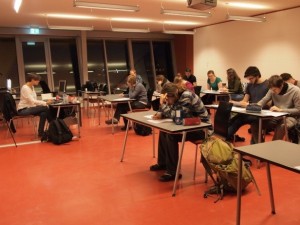
Students answering a questionnaire to evaluate the TE2LE activities. Photo: Paolo Simonelli.


